
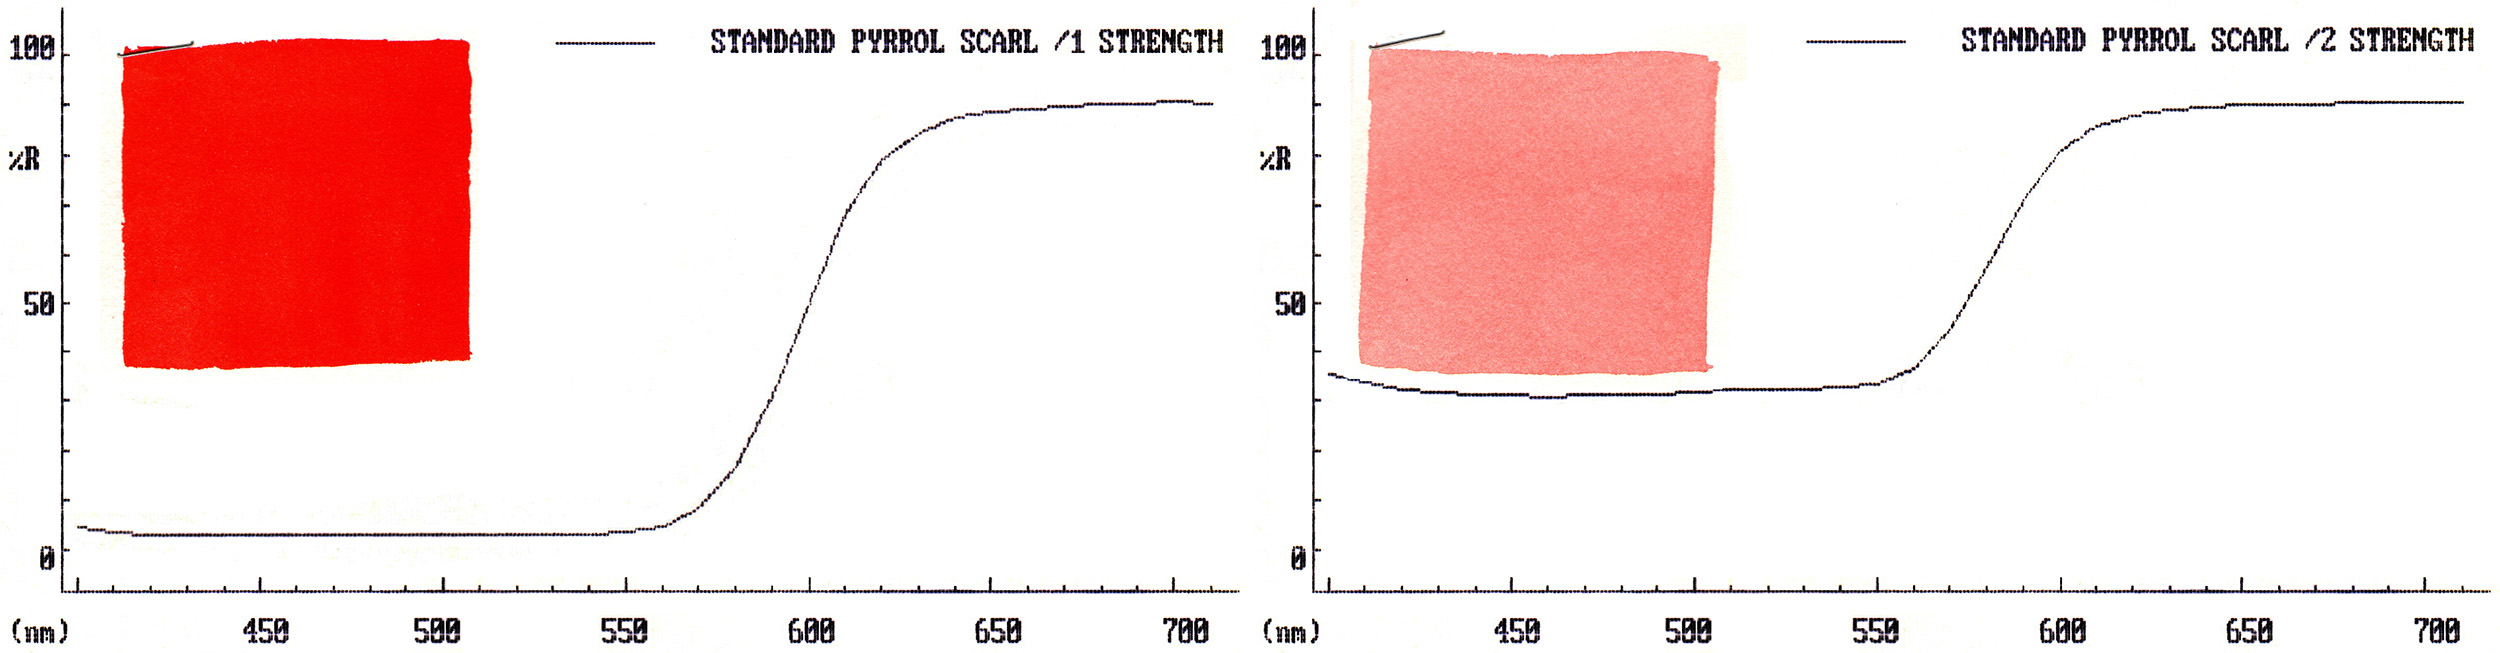
A reflectance curve translates the wavelengths of light that we see as a colored surface into a graph showing the colored wavelengths that are reflected when the surface is illuminated by white-light. Each wavelength is measured in nanometers (nm) by a spectro-photometer that is a color measurement device, sort of like a scanner. The line graph is generated by computer software.
Reflectance curves show the mixing potential of each pigment. They confirm a color’s bias or leaning towards warm or cool. It’s necessary to know a color’s bias for successful color mixing. We will study the reflectance curves of the main primary and secondary and neutral watercolor paints and assess how they can help us to mix the color we are aiming to mix for our painting.
Becoming familiar with the reflectance curves for each paint is an eye opener and will forever change your understanding of color and paints. Enjoy the ride!
MORE TO FOLLOW