
REFLECTANCE CURVES AND COLOR MIXING FOR ARTISTS
Reflectance curves show the color mixing potential of each pigment. They confirm a color’s bias or leaning towards warm or cool – It’s necessary to know a color’s bias for successful color mixing. Becoming familiar with the reflectance curves for each paint takes the guesswork out of color mixing. They forever change our understanding of color, paints and color mixing, and get us past the guesswork and color jargon surrounding artists’ paints. I included reflectance curves in my books, “Color Right from the Start” and “Hilary Page’s Guide to Watercolor Paints.” That’s how I became familiar with them!
So what is a reflectance curve? A reflectance curve translates the wavelengths of light that we see as a colored surface, into a graph showing the colored wavelengths that are reflected when the surface is illuminated by white light. Each wavelength is measured in nanometers (nm) by a spectro-photometer that is a color measurement device that can resemble a flat scanner. The line graph is generated by computer software.
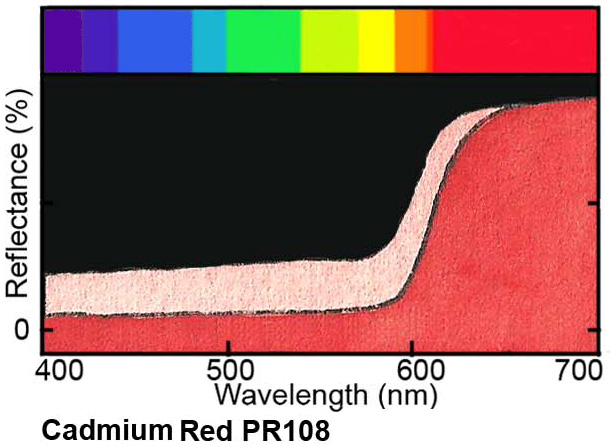
The curve for Cadmium Red PR108 is great teaching “curves”. The curve is flat under the purple and blue wavelengths (shown along the top of the graph,) and peaks only under the “red wavelengths. Most painters know that cadmium red cannot be mixed with any color to create purples. Putting two and two together, I deduced how paint reflectance curves work: To mix a colorful, saturated color from two paints, the paints have to reflect common wavelengths
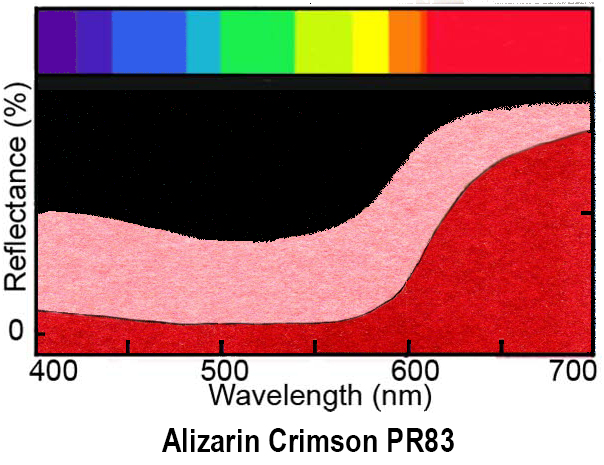 i.e. the graph of each must rise (even a bit) “under” the same colored wavelengths on their respective curves as in the curve for Alizarin Crimson PR83 (left). Unfortunately Alizarin Crimson PR83 is fugitive. Most manufacturers offer a “permanent” Alizarin Crimson. But the curves do not match PR83 and thus will not mix to produce attractive purples. Shush! Quinacridone Rose PV19(rs) is the best, lightfast, alternative to Alizarin Crimson PR83! You can see how useful it is to be conversant with reflectance curves!
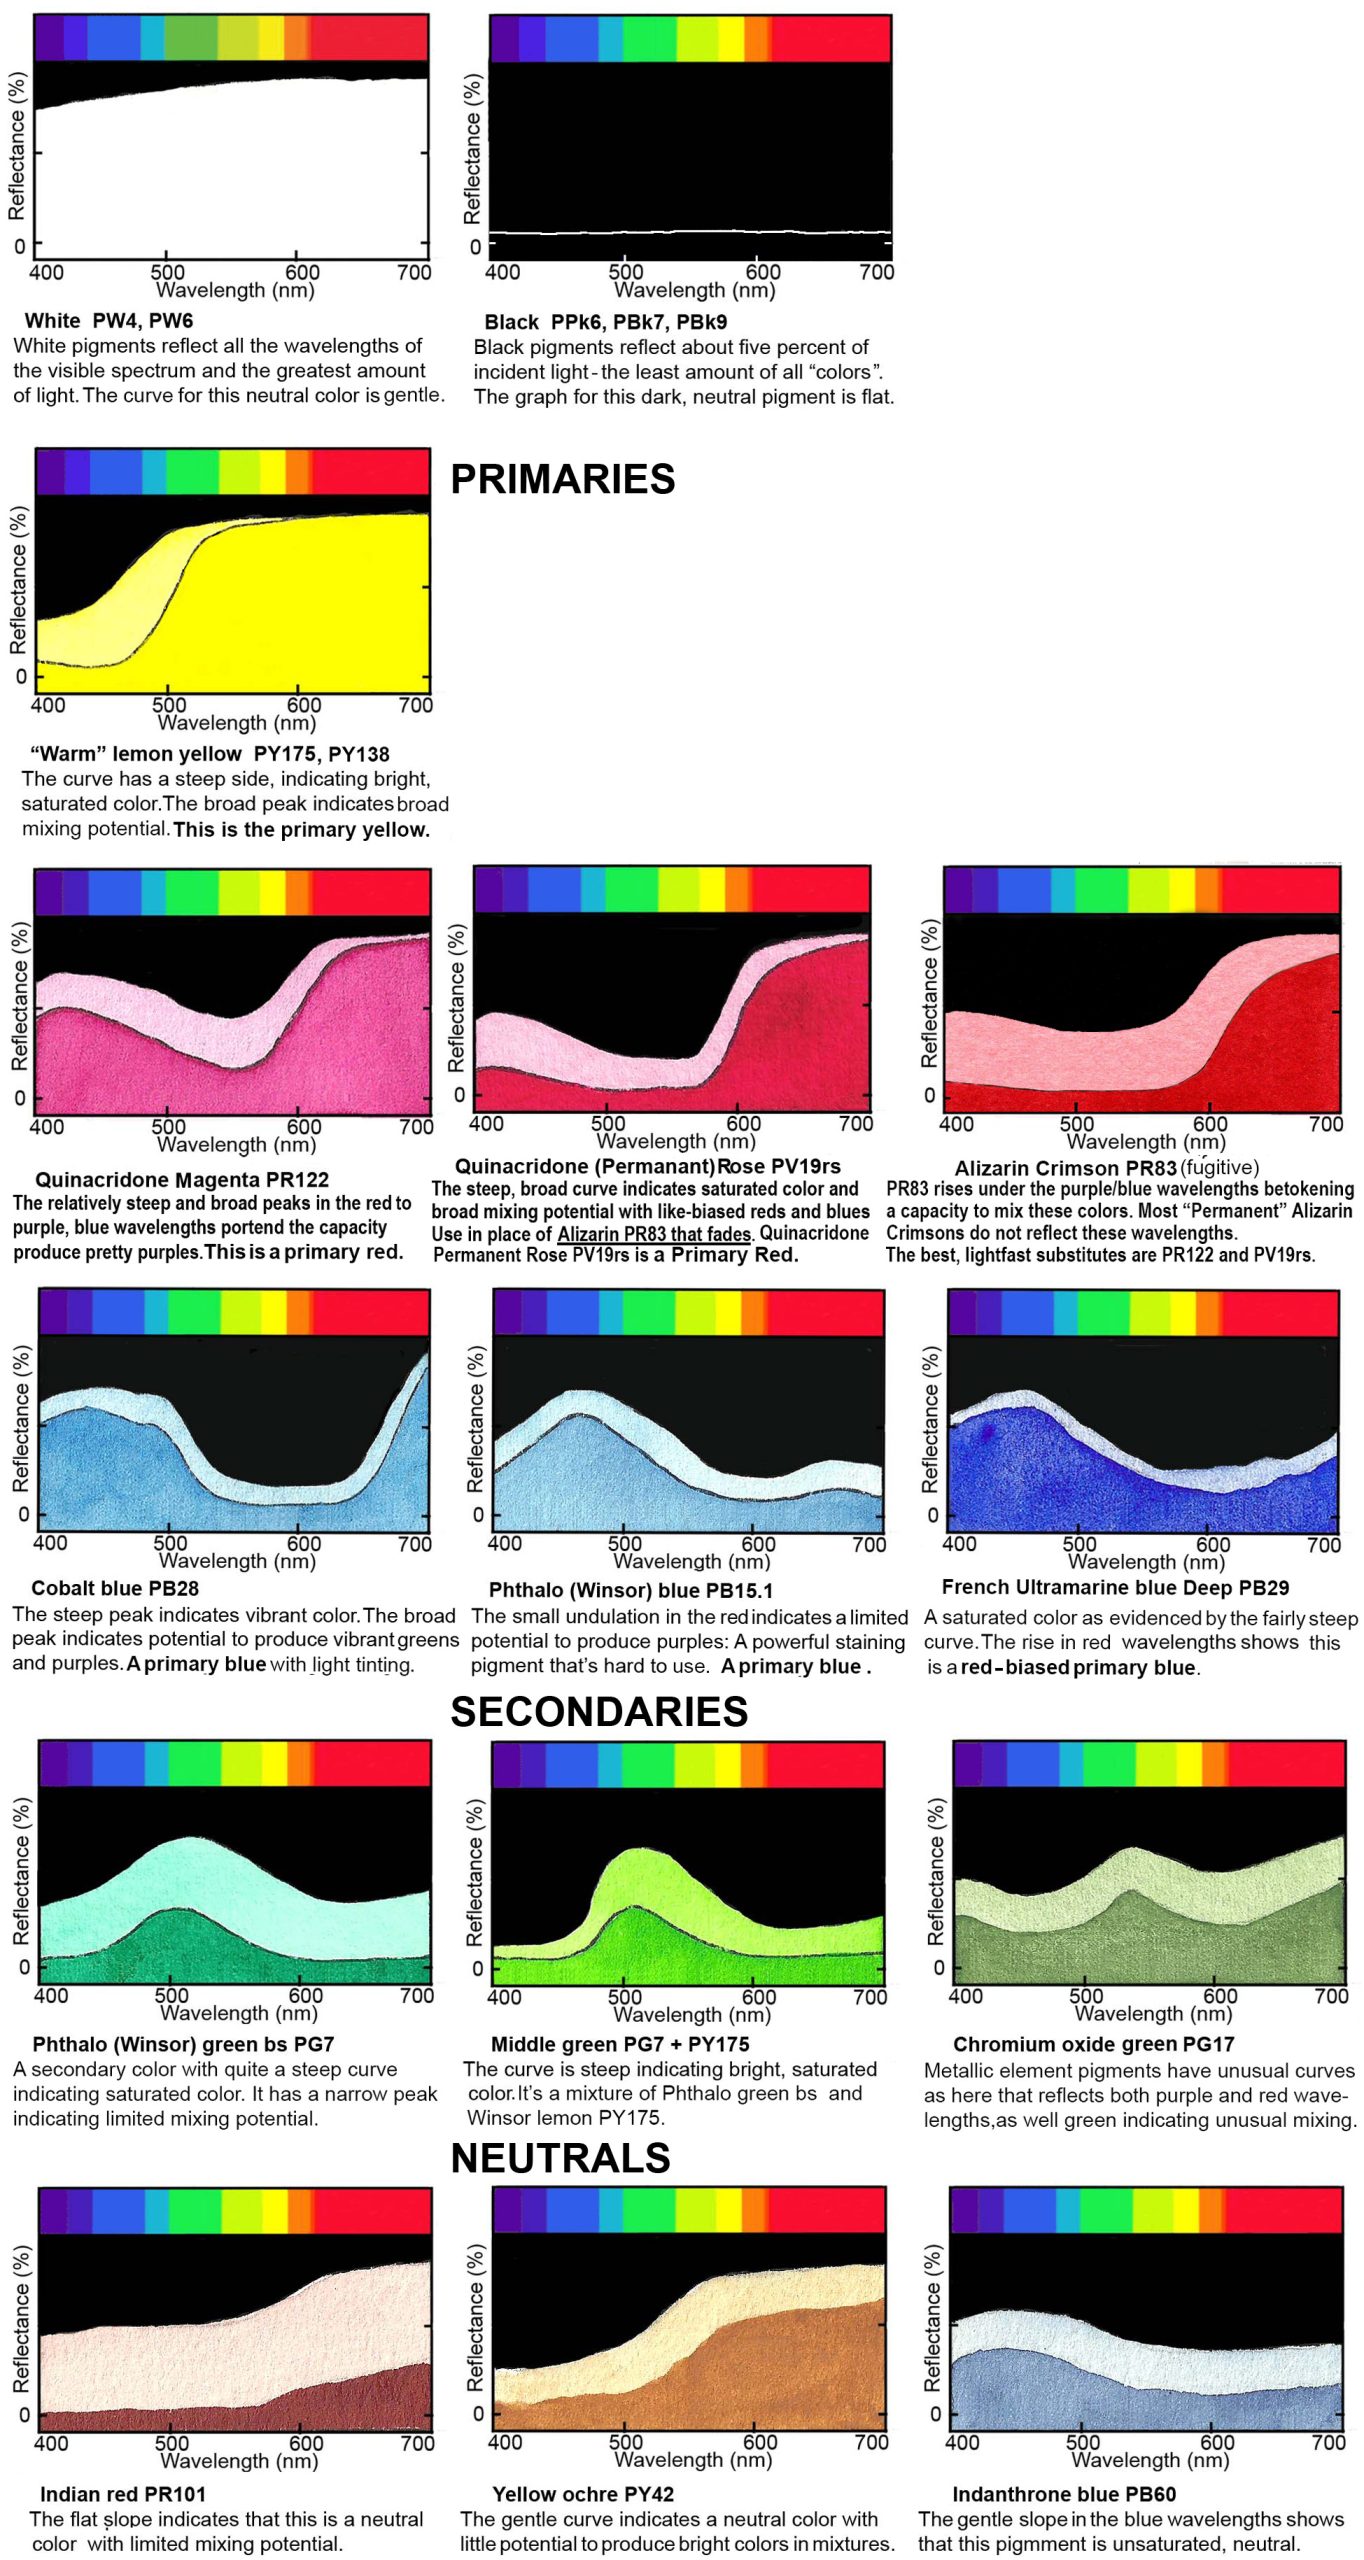
Study the sequence of Curves and read the Captions and you will quickly grasp how Reflectance Curves work – starting with white, black, primary, secondary and lastly neutral colors.
HOW I MADE THE REFLECTANCE CURVES
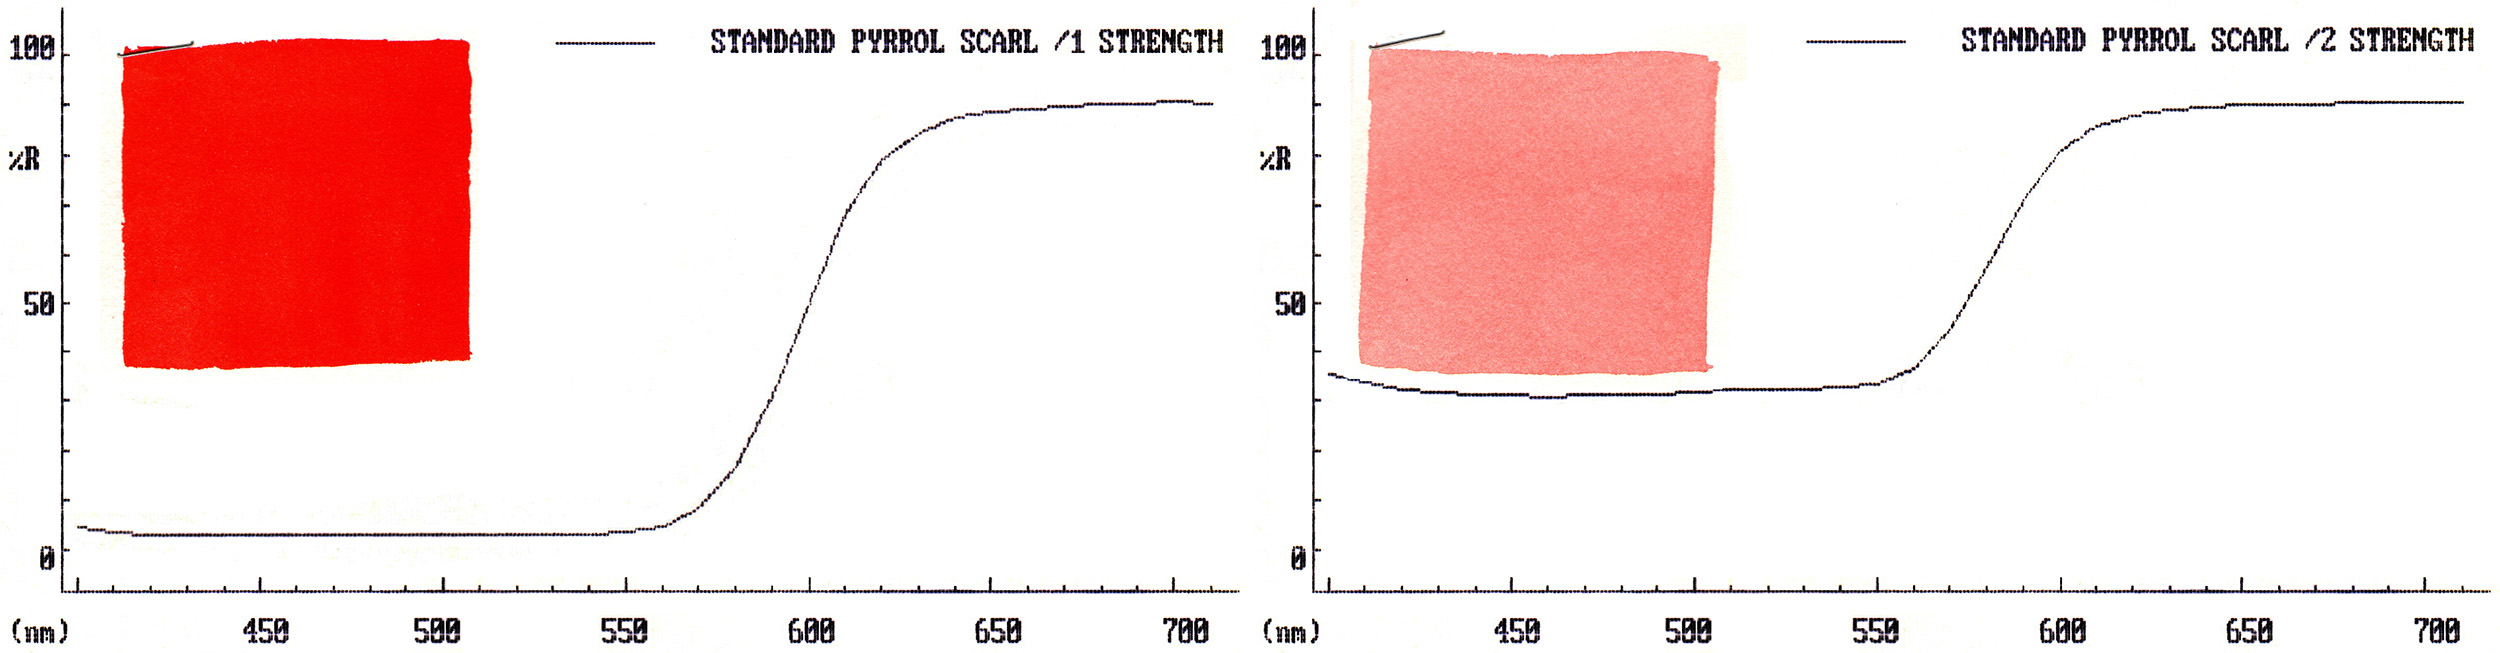 To make the curves, I first painted two 2×2″ squares of each pigment – one light and the other darker, as shown above. I sent the pairs (sometimes three shades) to the paint manufacturers Winsor & Newton, Daniel Smith Inc., and Holbein where their spectrophotometers converted the reflected wavelengths of their paints into line graphs that I transposed so all were the same scale. I next combined the light and dark line-curves. Within the graph I painted the light and dark colors in the appropriate place to match my 2×2″ samples. It was a mass of work! These days I could just drop them into the graph using Photoshop! Finally, I painted a strip of the spectral colors over each graph according to the wavelength.
It took a long time to figure out the best design for presenting reflectance curves to my fellow artists. I hope you find the information to be useful!